sklearn.metrics.explained_variance_score用法
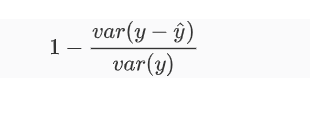
解释回归模型的方差得分,其值取值范围是[0,1],越接近于1说明自变量越能解释因变量 的方差变化,值越小则说明效果越差。
解释方差的得分,计算公式为:
sklearn.metrics.explained_variance_score(y_true,
                                         y_pred,
                                         *,
                                         sample_weight=None,
                                         multioutput='uniform_average')
Parameters :
y_true: array-like of shape (n_samples,) or (n_samples, n_outputs) Ground truth (correct) target values.
y_pred: array-like of shape (n_samples,) or (n_samples, n_outputs) Estimated target values.
sample_weight :array-like of shape (n_samples,), optional Sample weights.
multioutput :string in [‘raw_values’, ‘uniform_average’, ‘variance_weighted’] or array-like of shape (n_outputs) Defines aggregating of multiple output scores. Array-like value defines weights used to average scores.
- ‘raw_values’ : Returns a full set of scores in case of multioutput input.
- ‘uniform_average’ : Scores of all outputs are averaged with uniform weight.
- ‘variance_weighted’ :| Scores of all outputs are averaged, weighted by the variances of each individual output
Returns:
score :float or ndarray of floats
The explained variance or ndarray if ‘multioutput’ is ‘raw_values’.
Examples:
y_true = [3, -0.5, 2, 7]
y_pred = [2.5, 0.0, 2, 8]
explained_variance_score(y_true, y_pred)
# 0.9571734475374732

y_true = [[0.5, 1], [-1, 1], [7, -6]]
y_pred = [[0, 2], [-1, 2], [8, -5]]
explained_variance_score(y_true, y_pred, multioutput='uniform_average')
# 0.9838709677419355
print(explained_variance_score(y_test,y_pred))
print(1-np.var(y_test-y_pred)/np.var(y_test))