调整子图间距,调整整体空白
matplotlib.pyplot.subplots_adjust(left=None,
                                  bottom=None,
                                  right=None,
                                  top=None,
                                  wspace=None,
                                  hspace=None
                                 )

# 参数
left  = 0.125  # 子图(subplot)距画板(figure)左边的距离
right = 0.9    # 右边
bottom = 0.1   # 底部
top = 0.9      # 顶部
wspace = 0.2   # 子图水平间距
hspace = 0.2   # 子图垂直间距
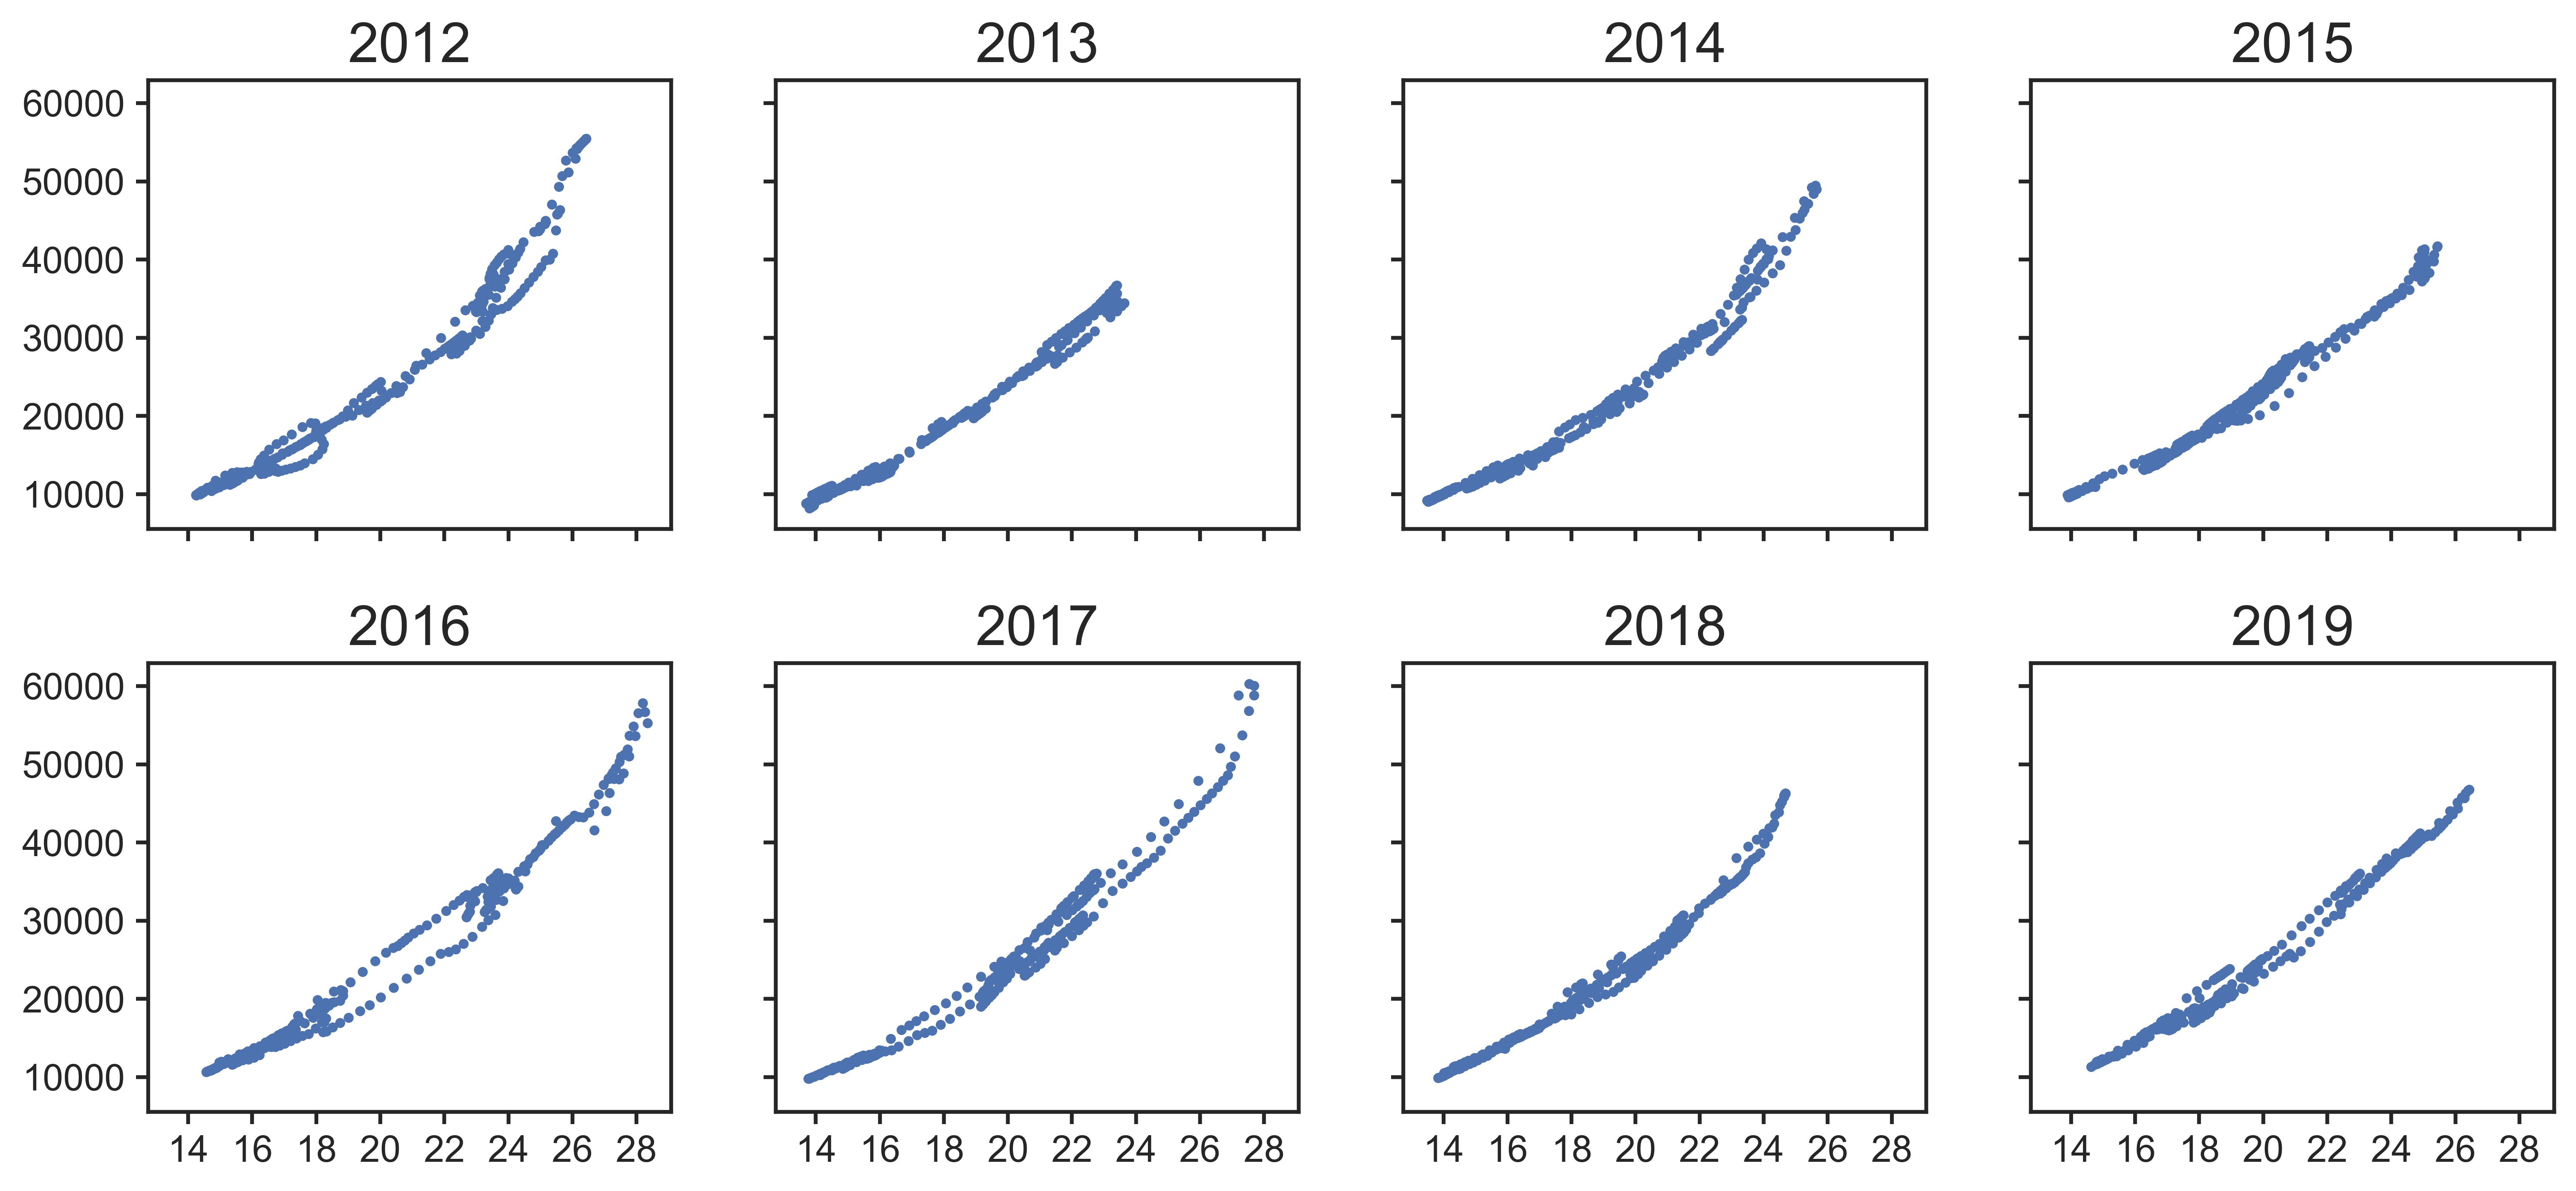
fig,ax = plt.subplots(2,4,figsize=(14,6),sharey=True,sharex=True)
plt.subplots_adjust(left=0.125, bottom=0.125, right=0.9, top=0.9,
                wspace=None, hspace=0.3)
for i,a in enumerate(ax.flat):
#     print(i)
    a.scatter(x=data.groupby('year').get_group(2012+i)['stage']
              ,y=data.groupby('year').get_group(2012+i)['discharge']
              ,s=5)
    a.set_title(2012+i,fontsize=18)
    a.xaxis.set_major_locator(MultipleLocator(2))  # 设置20倍数
    a.xaxis.set_tick_params(which='major',length=4,labelsize=12)


    a.yaxis.set_tick_params(which='major',length=4,labelsize=12)


plt.savefig('o1.jpeg',dpi=600,transparent=True,bbox_inches='tight' )
# plt.show()